Running Notebooks
The /docs/notebooks
directory in the repository contains Jupyter Notebooks
demonstrating pycontrails.
Local
To run these notebooks locally, clone or download the repository,
enter the docs directory, and launch jupyter lab:
$ git clone https://github.com/contrailcirrus/pycontrails.git
$ cd pycontrails/docs
$ jupyter lab        # or notebook
If you don’t have Jupyter installed,
install the optional pycontrails[jupyter] dependencies:
$ pip install "pycontrails[jupyter]" # Jupyter notebook and lab interface
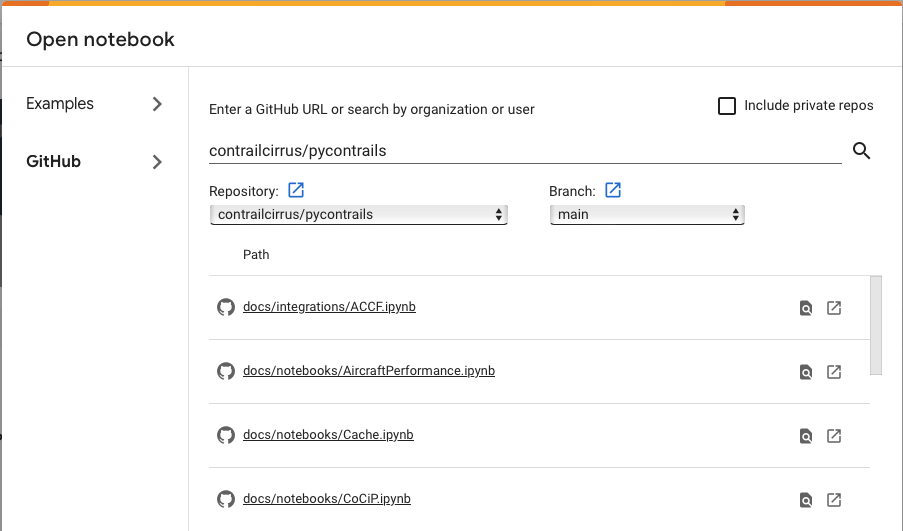
Colab
Notebooks can also be opened in Google Colab.
Select File -> Open -> Github, enter contrailcirrus/pycontrails, then
select the Notebook to open.
Alternatively, any notebook directly with the url https://colab.research.google.com/github/
+ the path to the notebook file on github.com
(e.g. CoCiP.ipynb)
pycontrails must be installed into Colab environment by adding the top cell:
!pip install pycontrails
Credentials and data must be added to each Colab environment. Colab integrates with Google Drive to load and save data and store secrets.
Data
ERA5
Many of these example notebooks make use of ERA5 met data. To avoid waiting for repeated CDS requests to load, it’s best to request the full dataset up front (the full ERA5 request downloads and caches ~1GB of meteorology data).
For compatibility with the pycontrails cache, you
can initiate this request through the pycontrails data interface.
The snippet below coincides with the ERA5 request in
CoCiP.ipynb.
We recommend that you either run the
CoCiP.ipynb notebook first, or run the snippet below before interacting with other notebooks.
from pycontrails.datalib.ecmwf import ERA5

time = ("2022-03-01 00:00:00", "2022-03-01 23:00:00")
pressure_levels = [350, 300, 250, 225, 200, 175, 150]
met_variables = ["t", "q", "u", "v", "w", "ciwc", "z", "cc"]
rad_variables = ["tsr", "ttr"]

ERA5(time=time, variables=met_variables, pressure_levels=pressure_levels).open_metdataset()
ERA5(time=time, variables=rad_variables).open_metdataset()
OpenSky
Because persistent contrails are a sparse phenomenon, it is a nontrivial task to construct authentic flights exhibiting characteristics from the vantage of contrail research. The data in the data/flight.csv file was constructed from the OpenSky database. We document the process here to ensure reproducibility.
OpenSky provides access to an impala shell
to query their database of ADS-B flight data.
The query below identifies flights at low altitude in the hour after
2022-03-01T00 (1646092800).
Such flights are expected to be in an initial climb phase or a terminal descent phase.
The two cases can be distinguished by consider the vertrate.
SELECT icao24, SUM(vertrate)
FROM state_vectors_data4
WHERE hour BETWEEN 1646092800 AND 1646092800 + 3600
    AND lon BETWEEN -80 and -30
    AND lat BETWEEN 30 and 40
    AND baroaltitude < 2000
GROUP BY icao24;
The query below selects one of the flights from the first output, keeping one waypoint at the start of each minute (the OpenSky database typically contains waypoint data with 1 second frequency.)
SELECT *
FROM state_vectors_data4
WHERE hour BETWEEN 1646092800 AND 1646092800 + 8 * 3600
    AND icao24 = 'acdd1b'
    AND time % 60 = 0
    AND baroaltitude IS NOT NULL
ORDER BY time;
The OpenSky impala shell simply streams text data over SSH.
To convert to a CSV, the output of the impala shell can be piped (or copy-pasted)
into the query_output.txt text file referenced below. The pandas
code below converts the output of the above query to the data/flight.csv
file included here.
import pandas as pd
df = pd.read_csv("query_output.txt", sep="|", skiprows=[0, 2], skipfooter=1, engine="python")
df = df.loc[:, ~df.columns.str.startswith("Unnamed")]
df.columns = df.columns.str.strip()

df = df.rename(columns={"lon": "longitude", "lat": "latitude", "baroaltitude": "altitude"})
df["time"] = pd.to_datetime(df["time"], unit="s")
df = df[["longitude", "latitude", "altitude", "time"]]

# artificially clip at 38000 ft to ensure we stay within met bounds
df["altitude"] = df["altitude"].clip(upper=11582.4)
df.to_csv("data/flight.csv", index=False)