ISSR
Model ice super-saturated regions (ISSR) of the atmosphere.
Met Data
Requires account with Copernicus Data Portal and local
~/.cdsapirc filewith credentials.
[1]:
# ignore pycontrails warning about ECMWF humidity scaling
import warnings

import matplotlib.pyplot as plt
import pandas as pd
from matplotlib.colors import ListedColormap

from pycontrails import Flight
from pycontrails.datalib.ecmwf import ERA5
from pycontrails.models.issr import ISSR

warnings.filterwarnings(message=r"[\s\S]* humidity scaling [\s\S]*", action="ignore")
Get Data
[2]:
time = ("2022-03-01 00:00:00", "2022-03-01 08:00:00")
pressure_levels = [300, 250, 200]
variables = ["t", "q"]
[3]:
era5 = ERA5(time=time, variables=variables, pressure_levels=pressure_levels)
met = era5.open_metdataset()
Evaluate model
[4]:
# run model for across full input domain
# outputs global ice super-saturated regions as 1.0, all other regions as 0.0
issr_mds = ISSR(met).eval()
issr = issr_mds["issr"]
[5]:
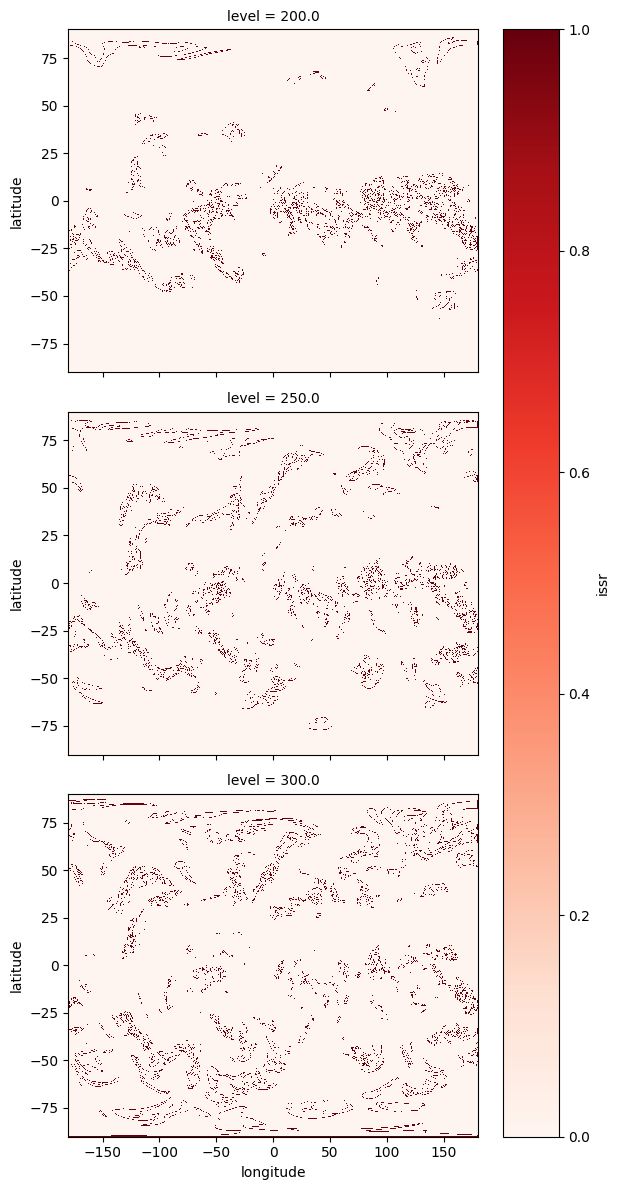
# edge detection algorithm using differentiation to reduce the areas to lines
issr_edges = issr.find_edges()
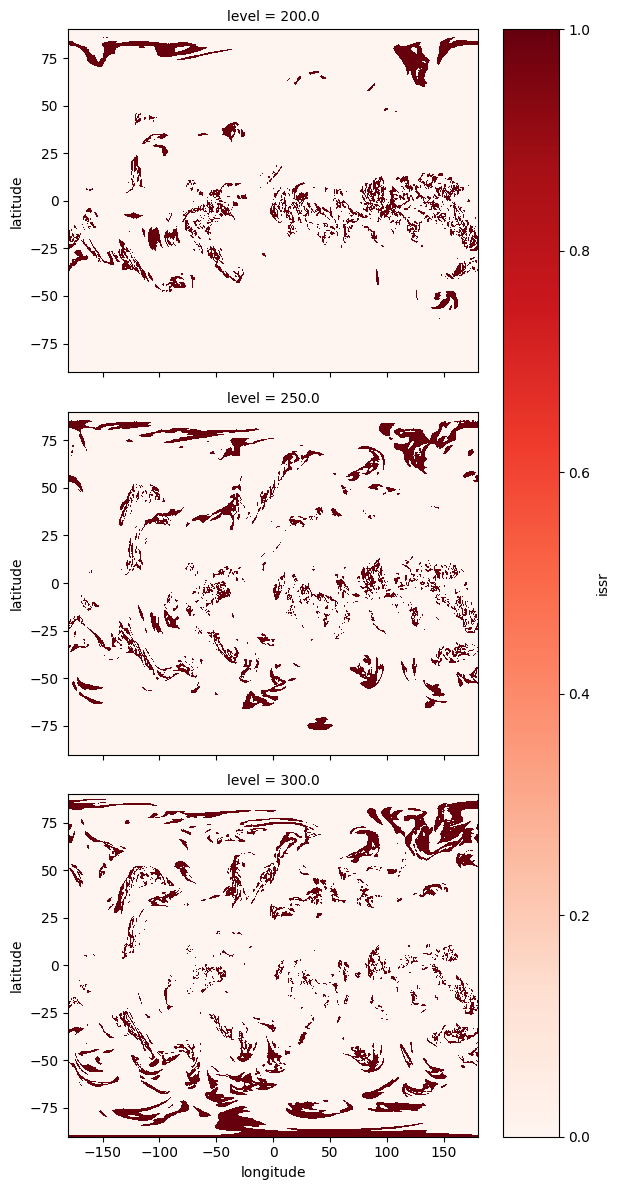
[6]:
da = issr.data.isel(time=0)
da.plot(x="longitude", y="latitude", row="level", cmap="Reds", figsize=(6, 12));
[7]:
# plot issr edges for each pressure level
da = issr_edges.data.isel(time=0)
da.plot(x="longitude", y="latitude", row="level", cmap="Reds", figsize=(6, 12));
Interpolate
Run model along a flight path
[8]:
# Load flight
df = pd.read_csv("data/flight.csv", parse_dates=["time"])
fl = Flight(data=df, flight_id="acdd1b", callsign="AAL1158")

fl
[8]:
Flight [4 keys x 175 length, 3 attributes]
| Attributes | |
|---|---|
| time | [2022-03-01 00:50:00, 2022-03-01 03:47:00] |
| longitude | [-97.026, -77.036] |
| latitude | [32.931, 38.854] |
| altitude | [190.5, 11582.4] |
| flight_id | acdd1b |
| callsign | AAL1158 |
| crs | EPSG:4326 |
| longitude | latitude | altitude | time | |
|---|---|---|---|---|
| 0 | -77.035950 | 38.829315 | 236.22 | 2022-03-01 00:50:00 |
| 1 | -77.038223 | 38.772675 | 708.66 | 2022-03-01 00:51:00 |
| 2 | -77.114231 | 38.744568 | 9471.66 | 2022-03-01 00:52:00 |
| 3 | -77.201965 | 38.739888 | 2019.30 | 2022-03-01 00:53:00 |
| 4 | -77.286191 | 38.745117 | 3032.76 | 2022-03-01 00:54:00 |
| ... | ... | ... | ... | ... |
| 170 | -97.025925 | 32.931379 | 190.50 | 2022-03-01 03:43:00 |
| 171 | -97.025922 | 32.930649 | 190.50 | 2022-03-01 03:44:00 |
| 172 | -97.025922 | 32.930649 | 190.50 | 2022-03-01 03:45:00 |
| 173 | -97.025922 | 32.930649 | 190.50 | 2022-03-01 03:46:00 |
| 174 | -97.025922 | 32.930649 | 190.50 | 2022-03-01 03:47:00 |
175 rows × 4 columns
[9]:
# run model for across full input domain
# outputs global ice super-saturated regions as 1, all other regions as 0
# np.nan is returned outside of the met domain
fl_out = ISSR(met=met).eval(source=fl)
fl_out["issr"]
[9]:
array([nan, nan,  0., nan, nan, nan, nan, nan, nan, nan, nan, nan, nan,
        0.,  0.,  0.,  0.,  0.,  0.,  0.,  0.,  0.,  0.,  0.,  0.,  0.,
        0.,  0.,  0.,  0.,  0.,  0.,  0.,  0.,  0.,  0.,  0.,  0.,  0.,
        0.,  0.,  0.,  0.,  0.,  0.,  0.,  0.,  0.,  0.,  0.,  0.,  0.,
        0.,  0.,  0.,  0.,  0.,  0.,  0.,  0.,  0.,  0.,  0.,  0.,  0.,
        0.,  0.,  0.,  0.,  0.,  0.,  0.,  0.,  0.,  0.,  0.,  0.,  0.,
        0.,  0.,  0.,  0.,  0.,  0.,  0.,  0.,  0.,  0.,  0.,  0.,  0.,
        0.,  0.,  0.,  0.,  0.,  0.,  0.,  0.,  0.,  0.,  0.,  0.,  0.,
        0.,  0.,  0.,  0.,  0.,  0.,  0.,  0.,  0.,  0.,  0.,  0.,  0.,
        0.,  0.,  0.,  0.,  0.,  0.,  0.,  0.,  0.,  0.,  0.,  0.,  0.,
        0.,  0.,  0.,  1.,  1.,  1.,  1.,  1.,  1.,  1.,  1.,  1.,  1.,
        1.,  1.,  1.,  1.,  1.,  1.,  1.,  0.,  1., nan, nan, nan, nan,
       nan, nan, nan, nan, nan, nan, nan, nan, nan, nan, nan, nan, nan,
       nan, nan, nan, nan, nan, nan])
[10]:
# Get the length of the Flight in the ISSR region
fl_out.length_met("issr")
[10]:
190812.60842238227
[11]:
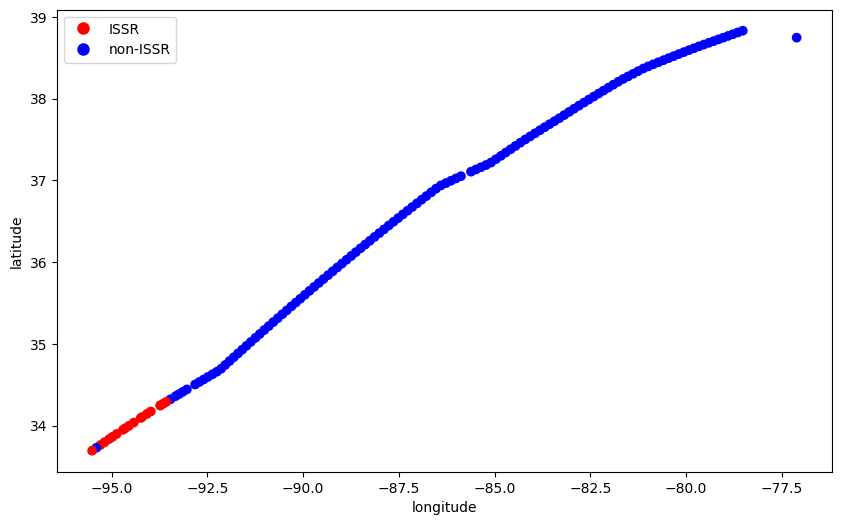
fig, ax = plt.subplots(figsize=(10, 6))

# Create colormap with red for ISSR and blue for non-ISSR
cmap = ListedColormap(["b", "r"])

ax.scatter(fl_out["longitude"], fl_out["latitude"], c=fl_out["issr"], cmap=cmap)


# Create legend
legend_elements = [
    plt.Line2D([0], [0], marker="o", color="w", label="ISSR", markerfacecolor="r", markersize=10),
    plt.Line2D(
        [0], [0], marker="o", color="w", label="non-ISSR", markerfacecolor="b", markersize=10
    ),
]
ax.legend(handles=legend_elements, loc="upper left")

ax.set(xlabel="longitude", ylabel="latitude");