Load flight data
Create Flight data structure for working with flight trajectories.
[1]:
import numpy as np
import pandas as pd

from pycontrails import Flight
from pycontrails.datalib.ecmwf import ERA5
Create Flight instance
From Numpy Arrays
[2]:
# waypoints
longitude = np.linspace(0, 50, 100)
latitude = np.linspace(0, 10, 100)
altitude = np.linspace(11000, 11500, 100)
time = pd.date_range("2022-03-01 00:00:00", "2022-03-01 02:00:00", periods=100)

fl = Flight(longitude=longitude, latitude=latitude, altitude=altitude, time=time, flight_id="my_id")
fl
[2]:
Flight [4 keys x 100 length, 1 attributes]
| Attributes | |
|---|---|
| time | [2022-03-01 00:00:00, 2022-03-01 02:00:00] |
| longitude | [0.0, 50.0] |
| latitude | [0.0, 10.0] |
| altitude | [11000.0, 11500.0] |
| flight_id | my_id |
| longitude | latitude | time | altitude | |
|---|---|---|---|---|
| 0 | 0.000000 | 0.00000 | 2022-03-01 00:00:00.000000000 | 11000.000000 |
| 1 | 0.505051 | 0.10101 | 2022-03-01 00:01:12.727272727 | 11005.050505 |
| 2 | 1.010101 | 0.20202 | 2022-03-01 00:02:25.454545454 | 11010.101010 |
| 3 | 1.515152 | 0.30303 | 2022-03-01 00:03:38.181818181 | 11015.151515 |
| 4 | 2.020202 | 0.40404 | 2022-03-01 00:04:50.909090909 | 11020.202020 |
| ... | ... | ... | ... | ... |
| 95 | 47.979798 | 9.59596 | 2022-03-01 01:55:09.090909090 | 11479.797980 |
| 96 | 48.484848 | 9.69697 | 2022-03-01 01:56:21.818181818 | 11484.848485 |
| 97 | 48.989899 | 9.79798 | 2022-03-01 01:57:34.545454545 | 11489.898990 |
| 98 | 49.494949 | 9.89899 | 2022-03-01 01:58:47.272727272 | 11494.949495 |
| 99 | 50.000000 | 10.00000 | 2022-03-01 02:00:00.000000000 | 11500.000000 |
100 rows × 4 columns
From Pandas DataFrame
[3]:
# Example flight
df = pd.DataFrame()
df["longitude"] = np.linspace(0, 50, 100)
df["latitude"] = np.linspace(0, 10, 100)
df["altitude"] = 11000
df["time"] = pd.date_range("2022-03-01 00:00:00", "2022-03-01 02:00:00", periods=100)
fl = Flight(data=df, flight_id="ABC")
fl
[3]:
Flight [4 keys x 100 length, 1 attributes]
| Attributes | |
|---|---|
| time | [2022-03-01 00:00:00, 2022-03-01 02:00:00] |
| longitude | [0.0, 50.0] |
| latitude | [0.0, 10.0] |
| altitude | [11000.0, 11000.0] |
| flight_id | ABC |
| longitude | latitude | altitude | time | |
|---|---|---|---|---|
| 0 | 0.000000 | 0.00000 | 11000.0 | 2022-03-01 00:00:00.000000000 |
| 1 | 0.505051 | 0.10101 | 11000.0 | 2022-03-01 00:01:12.727272727 |
| 2 | 1.010101 | 0.20202 | 11000.0 | 2022-03-01 00:02:25.454545454 |
| 3 | 1.515152 | 0.30303 | 11000.0 | 2022-03-01 00:03:38.181818181 |
| 4 | 2.020202 | 0.40404 | 11000.0 | 2022-03-01 00:04:50.909090909 |
| ... | ... | ... | ... | ... |
| 95 | 47.979798 | 9.59596 | 11000.0 | 2022-03-01 01:55:09.090909090 |
| 96 | 48.484848 | 9.69697 | 11000.0 | 2022-03-01 01:56:21.818181818 |
| 97 | 48.989899 | 9.79798 | 11000.0 | 2022-03-01 01:57:34.545454545 |
| 98 | 49.494949 | 9.89899 | 11000.0 | 2022-03-01 01:58:47.272727272 |
| 99 | 50.000000 | 10.00000 | 11000.0 | 2022-03-01 02:00:00.000000000 |
100 rows × 4 columns
Create Flight without Waypoints
[4]:
# Example flight
attrs = dict(flight_id="1234", equip="A532")
fl = Flight.create_empty(attrs=attrs)
fl
[4]:
Flight [4 keys x 0 length, 2 attributes]
| Attributes | |
|---|---|
| flight_id | 1234 |
| equip | A532 |
| longitude | latitude | time | altitude |
|---|
Create from CSV file
[5]:
# load flight
df = pd.read_csv("data/flight.csv")
fl = Flight(data=df, flight_id="csv")
fl
[5]:
Flight [4 keys x 175 length, 1 attributes]
| Attributes | |
|---|---|
| time | [2022-03-01 00:50:00, 2022-03-01 03:47:00] |
| longitude | [-97.026, -77.036] |
| latitude | [32.931, 38.854] |
| altitude | [190.5, 11582.4] |
| flight_id | csv |
| longitude | latitude | altitude | time | |
|---|---|---|---|---|
| 0 | -77.035950 | 38.829315 | 236.22 | 2022-03-01 00:50:00 |
| 1 | -77.038223 | 38.772675 | 708.66 | 2022-03-01 00:51:00 |
| 2 | -77.114231 | 38.744568 | 9471.66 | 2022-03-01 00:52:00 |
| 3 | -77.201965 | 38.739888 | 2019.30 | 2022-03-01 00:53:00 |
| 4 | -77.286191 | 38.745117 | 3032.76 | 2022-03-01 00:54:00 |
| ... | ... | ... | ... | ... |
| 170 | -97.025925 | 32.931379 | 190.50 | 2022-03-01 03:43:00 |
| 171 | -97.025922 | 32.930649 | 190.50 | 2022-03-01 03:44:00 |
| 172 | -97.025922 | 32.930649 | 190.50 | 2022-03-01 03:45:00 |
| 173 | -97.025922 | 32.930649 | 190.50 | 2022-03-01 03:46:00 |
| 174 | -97.025922 | 32.930649 | 190.50 | 2022-03-01 03:47:00 |
175 rows × 4 columns
Using the Flight instance
The flight.data attribute is a dictionary with np.ndarray values
[6]:
# waypoints
longitude = np.linspace(0, 50, 10)
latitude = np.linspace(0, 10, 10)
altitude = np.linspace(11000, 11500, 10)
time = pd.date_range("2022-03-01 00:00:00", "2022-03-01 02:00:00", periods=10)
attrs = {"flight_id": "ABC123"}
fl = Flight(longitude=longitude, latitude=latitude, altitude=altitude, time=time, attrs=attrs)
[7]:
fl.data.keys()
[7]:
dict_keys(['longitude', 'latitude', 'time', 'altitude'])
Flight attributes are stored in a dictionary on the attrs attribute.
[8]:
fl.attrs
[8]:
{'flight_id': 'ABC123'}
Data can be set / get from the Flight like a dictionary
[9]:
# get
lat = fl["latitude"]

# set
lat[5] = 20
fl["latitude"] = lat

# get updated
fl["latitude"][5]
[9]:
np.float64(20.0)
The Flight class contains the following convenience properties
[10]:
# Pressure altitude, in hPa
fl.level
[10]:
array([226.3170091 , 224.34300442, 222.3862176 , 220.44649846,
       218.52369813, 216.61766904, 214.7282649 , 212.85534072,
       210.99875274, 209.15835847])
[11]:
# Altitude, in ft
fl.altitude_ft
[11]:
array([36089.23884514, 36271.5077282 , 36453.77661126, 36636.04549431,
       36818.31437737, 37000.58326043, 37182.85214348, 37365.12102654,
       37547.38990959, 37729.65879265])
[12]:
# Values that are constant along the flight path

# set constant value along flight waypoints
fl["constant"] = np.full(shape=fl.shape, fill_value=100)

fl.constants
[12]:
{'constant': 100, 'flight_id': 'ABC123'}
[13]:
# Flight distance, in meters
fl.length
[13]:
np.float64(7818835.115366629)
[14]:
# Time start/end
print(fl.time_start)
print(fl.time_end)
2022-03-01 00:00:00
2022-03-01 02:00:00
[15]:
# Flight duration, as a pandas Timedelta
fl.duration
[15]:
Timedelta('0 days 02:00:00')
[16]:
# Max time gap between waypoints, as a pandas Timedelta
fl.max_time_gap
[16]:
Timedelta('0 days 00:13:20')
[17]:
# Max distance gap between waypoints, in meters
fl.max_distance_gap
[17]:
np.float64(1831403.3492360476)
Intersect with Met data
[18]:
# waypoints
longitude = np.linspace(0, 50, 50)
latitude = np.linspace(0, 10, 50)
altitude = np.linspace(11000, 11500, 50)
time = pd.date_range("2022-03-01 00:00:00", "2022-03-01 02:00:00", periods=50)
fl = Flight(longitude=longitude, latitude=latitude, altitude=altitude, time=time, flight_id="ABC")
[19]:
# domain
time = ("2022-03-01 00:00:00", "2022-03-01 03:00:00")
variables = ["t", "q", "u", "v", "w", "ciwc", "z", "cc"]
pressure_levels = [300, 250, 200]

# get met data
era5 = ERA5(time=time, variables=variables, pressure_levels=pressure_levels)
met = era5.open_metdataset()
[20]:
# interpolate to nearest grid member
fl.intersect_met(met["air_temperature"], method="nearest")
[20]:
array([231.63002014, 231.50404358, 231.72962952, 231.08802795,
       218.82527161, 218.83894348, 219.00691223, 218.07820129,
       218.66316223, 219.61824036, 219.48347473, 219.66511536,
       219.89851379, 219.86070251, 219.95152283, 220.17027283,
       220.15171814, 220.06773376, 219.71324158, 219.51890564,
       219.56480408, 219.54624939, 219.39976501, 219.19078064,
       219.01890564, 219.02085876, 219.36558533, 219.42710876,
       219.39292908, 219.4964447 , 219.63902283, 219.63316345,
       219.80308533, 219.7230072 , 218.88414001, 218.68785095,
       219.5901947 , 219.66666748, 219.75786176, 219.57713128,
       219.53733741, 219.87641433, 219.74045194, 219.47930469,
       219.34500039, 219.28696766, 219.14354393, 219.04074311,
       218.90146457, 218.93462613])
[21]:
# linear interpolation
fl.intersect_met(met["air_temperature"], method="linear")
[21]:
array([225.77816471, 225.39081749, 225.21864816, 224.88374538,
       225.13023744, 224.75325132, 224.69848275, 224.51222972,
       224.65632724, 225.06847509, 225.27786534, 225.23722457,
       225.27403387, 225.21623551, 225.02269775, 225.16207685,
       225.02480733, 224.83869026, 224.50832969, 224.36192212,
       224.27046507, 224.02768754, 223.71681302, 223.55308994,
       223.37665811, 223.3523213 , 223.48887953, 223.45060716,
       223.46022722, 223.51031432, 223.47441969, 223.33966081,
       223.3370329 , 223.19574842, 222.68131634, 222.43277034,
       222.99376785, 222.91001375, 222.9434397 , 222.70614349,
       222.66987003, 222.84312141, 222.59153886, 222.31971702,
       222.06891378, 221.91065757, 221.70157927, 221.52471477,
       221.33913034, 221.26541337])
Get Lengths
[22]:
# total flight length in meters
fl.length
[22]:
np.float64(5642421.5973290345)
[23]:
# intersect flight with air temperature
fl["temp"] = fl.intersect_met(met["air_temperature"], method="nearest")

# get the length of the flight where ambient temperature is > 226 K
fl.length_met("temp", threshold=226)
[23]:
np.float64(462850.7958842697)
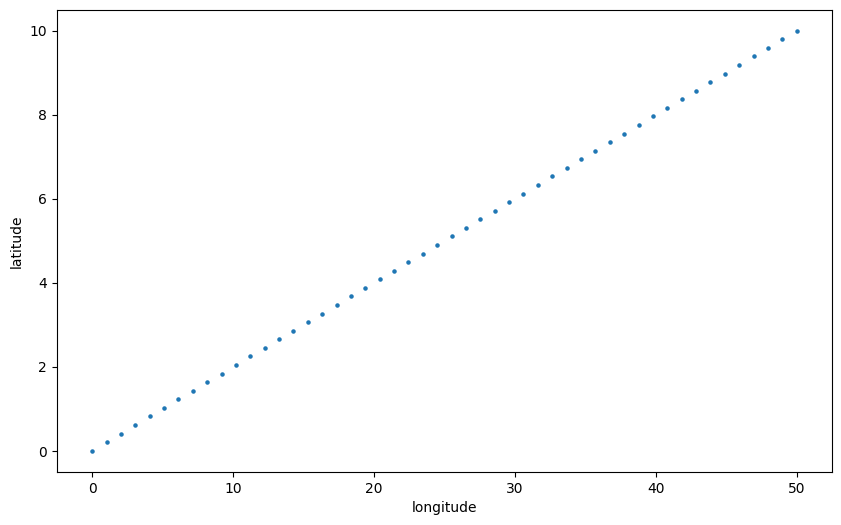
Plot and Resample
[24]:
fl.plot(kind="scatter", s=5, figsize=(10, 6))
fl.max_distance_gap
[24]:
np.float64(115715.16936791067)
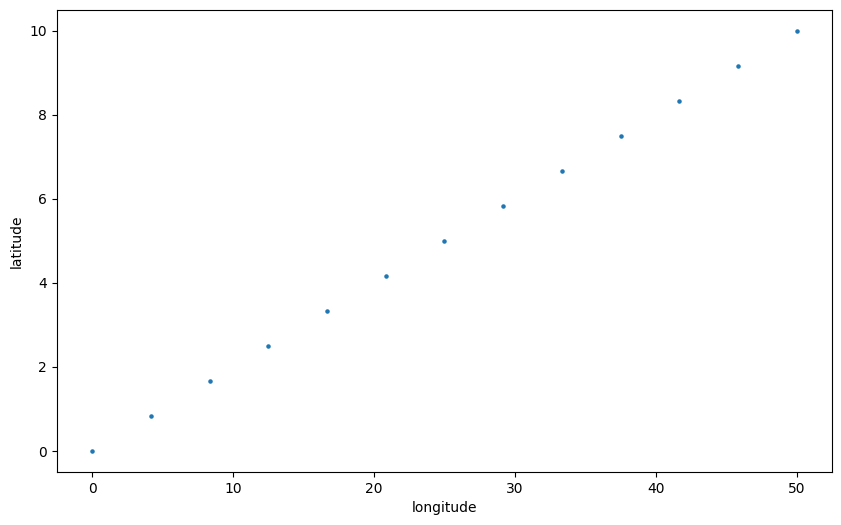
[25]:
# resample with 10 minute waypoints
fl = fl.resample_and_fill("10min")

fl.plot(kind="scatter", s=5, figsize=(10, 6))
fl.max_distance_gap
[25]:
np.float64(472488.41576537804)
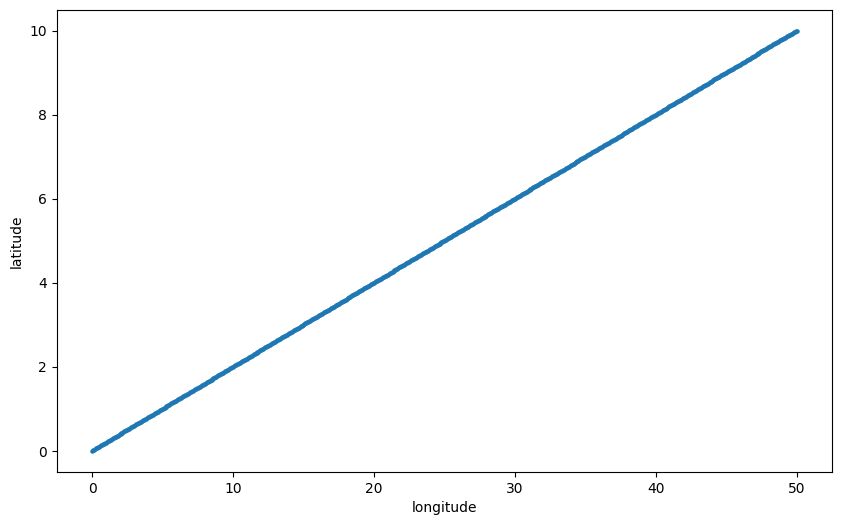
[26]:
# resample with 10 second waypoints
fl = fl.resample_and_fill("10s")

fl.plot(kind="scatter", s=5, figsize=(10, 6))
fl.max_distance_gap
[26]:
np.float64(7874.98815033573)
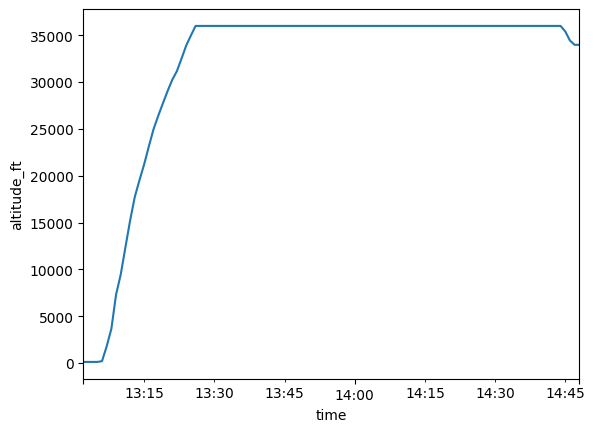
Clean and smooth a noisy flight with gaps
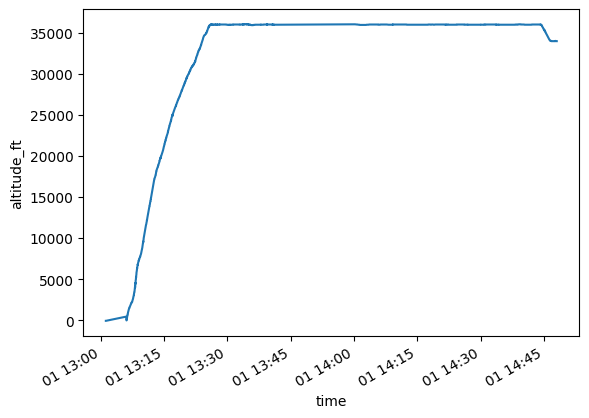
[27]:
df = pd.read_csv("data/flight-noisy.csv")
df["time"] = pd.to_datetime(df["time"])
f = Flight(df, drop_duplicated_times=True)
f.plot_profile();
[28]:
f = f.clean_and_resample(nominal_rocd=20)
f.plot_profile();