Run CoCiP over a flight
This tutorial walks through an example of running the Contrail Cirrus Predicition (CoCiP) model evaluation along a flight trajectory.
References
Schumann, U. “A Contrail Cirrus Prediction Model.” Geoscientific Model Development 5, no. 3 (May 3, 2012): 543–80. https://doi.org/10.5194/gmd-5-543-2012.
Schumann, U., B. Mayer, K. Graf, and H. Mannstein. “A Parametric Radiative Forcing Model for Contrail Cirrus.” Journal of Applied Meteorology and Climatology 51, no. 7 (July 2012): 1391–1406. https://doi.org/10.1175/JAMC-D-11-0242.1.
Teoh, Roger, Ulrich Schumann, Arnab Majumdar, and Marc E. J. Stettler. “Mitigating the Climate Forcing of Aircraft Contrails by Small-Scale Diversions and Technology Adoption.” Environmental Science & Technology 54, no. 5 (March 3, 2020): 2941–50. https://doi.org/10.1021/acs.est.9b05608.
Teoh, Roger, Ulrich Schumann, Edward Gryspeerdt, Marc Shapiro, Jarlath Molloy, George Koudis, Christiane Voigt, and Marc Stettler. “Aviation Contrail Climate Effects in the North Atlantic from 2016–2021.” Atmospheric Chemistry and Physics Discussions, March 30, 2022, 1–27. https://doi.org/10.5194/acp-2022-169.
[1]:
import pandas as pd

from pycontrails import Flight
from pycontrails.datalib.ecmwf import ERA5
from pycontrails.models.cocip import Cocip
from pycontrails.models.humidity_scaling import ConstantHumidityScaling
from pycontrails.physics import units
Load Flight
Load flight trajectory from dataset prepared by Roger Teoh in https://doi.org/10.5194/acp-2022-169
[2]:
# load flight waypoints
df_flight = pd.read_csv("data/flight-cocip.csv")
df_flight.head()
[2]:
| Longitude (degrees) | Latitude (degrees) | Altitude (feet) | UTC time | True airspeed (m s-1) | Mach Number | Aircraft mass (kg) | Fuel mass flow rate (kg s-1) | Overall propulsion efficiency | nvPM number emissions index (kg-1) | ICAO Aircraft Type | Wingspan (m) | |
|---|---|---|---|---|---|---|---|---|---|---|---|---|
| 0 | -10.070 | 55.185 | 36000 | 1546651185 | 230.858 | 0.791 | 236479.000 | 1.654 | 0.4 | 1500000000000000 | A359 | 64.75 |
| 1 | -10.273 | 55.222 | 36000 | 1546651245 | 230.682 | 0.790 | 236379.755 | 1.657 | 0.4 | 1500000000000000 | A359 | 64.75 |
| 2 | -10.476 | 55.258 | 36000 | 1546651305 | 230.563 | 0.789 | 236280.355 | 1.659 | 0.4 | 1500000000000000 | A359 | 64.75 |
| 3 | -10.680 | 55.295 | 36000 | 1546651365 | 230.501 | 0.789 | 236180.791 | 1.661 | 0.4 | 1500000000000000 | A359 | 64.75 |
| 4 | -10.883 | 55.331 | 36000 | 1546651425 | 230.476 | 0.789 | 236081.128 | 1.662 | 0.4 | 1500000000000000 | A359 | 64.75 |
[3]:
# constant properties along the length of the flight
attrs = {
    "flight_id": "fid",
    "aircraft_type": df_flight["ICAO Aircraft Type"].values[0],
    "wingspan": df_flight["Wingspan (m)"].values[0],
}
Process the flight into a format expected by pycontrails. See pycontrails.Flight for interface details.
[4]:
# convert UTC timestamp to np.datetime64
df_flight["time"] = pd.to_datetime(df_flight["UTC time"], origin="unix", unit="s")

# set altitude in m
df_flight["altitude"] = units.ft_to_m(df_flight["Altitude (feet)"])

# rename a few columns for compatibility with `Flight` requirements
df_flight = df_flight.rename(
    columns={
        "Longitude (degrees)": "longitude",
        "Latitude (degrees)": "latitude",
        "True airspeed (m s-1)": "true_airspeed",
        "Mach Number": "mach_number",
        "Aircraft mass (kg)": "aircraft_mass",
        "Fuel mass flow rate (kg s-1)": "fuel_flow",
        "Overall propulsion efficiency": "engine_efficiency",
        "nvPM number emissions index (kg-1)": "nvpm_ei_n",
    }
)

# clean up a few columns before building Flight class
df_flight = df_flight.drop(
    columns=["ICAO Aircraft Type", "Wingspan (m)", "UTC time", "Altitude (feet)"]
)

fl = Flight(data=df_flight, attrs=attrs)
fl
[4]:
| Attributes | |
|---|---|
| time | [2019-01-05 01:19:45, 2019-01-05 04:00:21] |
| longitude | [-50.0, -10.07] |
| latitude | [55.185, 61.089] |
| altitude | [10972.8, 10972.8] |
| flight_id | fid |
| aircraft_type | A359 |
| wingspan | 64.75 |
| longitude | latitude | true_airspeed | mach_number | aircraft_mass | fuel_flow | engine_efficiency | nvpm_ei_n | altitude | time | |
|---|---|---|---|---|---|---|---|---|---|---|
| 0 | -10.070 | 55.185 | 230.858 | 0.791 | 236479.000 | 1.654 | 0.4 | 1500000000000000 | 10972.8 | 2019-01-05 01:19:45 |
| 1 | -10.273 | 55.222 | 230.682 | 0.790 | 236379.755 | 1.657 | 0.4 | 1500000000000000 | 10972.8 | 2019-01-05 01:20:45 |
| 2 | -10.476 | 55.258 | 230.563 | 0.789 | 236280.355 | 1.659 | 0.4 | 1500000000000000 | 10972.8 | 2019-01-05 01:21:45 |
| 3 | -10.680 | 55.295 | 230.501 | 0.789 | 236180.791 | 1.661 | 0.4 | 1500000000000000 | 10972.8 | 2019-01-05 01:22:45 |
| 4 | -10.883 | 55.331 | 230.476 | 0.789 | 236081.128 | 1.662 | 0.4 | 1500000000000000 | 10972.8 | 2019-01-05 01:23:45 |
| ... | ... | ... | ... | ... | ... | ... | ... | ... | ... | ... |
| 157 | -49.002 | 61.027 | 254.806 | 0.860 | 220251.787 | 1.814 | 0.4 | 1500000000000000 | 10972.8 | 2019-01-05 03:56:41 |
| 158 | -49.274 | 61.019 | 255.051 | 0.861 | 220142.920 | 1.830 | 0.4 | 1500000000000000 | 10972.8 | 2019-01-05 03:57:41 |
| 159 | -49.546 | 61.010 | 255.317 | 0.862 | 220033.115 | 1.811 | 0.4 | 1500000000000000 | 10972.8 | 2019-01-05 03:58:41 |
| 160 | -49.818 | 61.000 | 255.063 | 0.862 | 219924.426 | 0.309 | 0.4 | 1500000000000000 | 10972.8 | 2019-01-05 03:59:41 |
| 161 | -50.000 | 61.000 | 235.015 | 0.794 | 219912.051 | 1.567 | 0.4 | 1500000000000000 | 10972.8 | 2019-01-05 04:00:21 |
162 rows × 10 columns
Load meteorology from ECMWF
[5]:
# Get met domain from Flight
time = (fl.time_start.floor("1h"), fl.time_end.ceil("1h") + pd.Timedelta(hours=10))

# Select pressure levels
pressure_levels = [
    400,
    350,
    300,
    250,
    225,
    200,
    175,
    150,
]
[6]:
# Download met data from CDS
era5pl = ERA5(time=time, variables=Cocip.met_variables, pressure_levels=pressure_levels)
era5sl = ERA5(time=time, variables=Cocip.rad_variables)
[7]:
# Create `MetDataset` from sources
met = era5pl.open_metdataset()
rad = era5sl.open_metdataset()
Set up model
[8]:
params = {
    "process_emissions": False,
    "verbose_outputs": True,
    "humidity_scaling": ConstantHumidityScaling(rhi_adj=0.98),
    "max_age": pd.Timedelta(hours=10),
}
cocip = Cocip(met=met, rad=rad, params=params)
Run model
[9]:
fl_out = cocip.eval(source=fl)
Review output
The output flight has the original flight data with many new variables added from the evaluation.
[10]:
fl_out
[10]:
| Attributes | |
|---|---|
| time | [2019-01-05 01:19:45, 2019-01-05 04:00:21] |
| longitude | [-50.0, -10.07] |
| latitude | [55.185, 61.089] |
| altitude | [10972.8, 10972.8] |
| flight_id | fid |
| aircraft_type | A359 |
| wingspan | 64.75 |
| rhi_adj | 0.98 |
| humidity_scaling_name | constant_scale |
| humidity_scaling_formula | rhi -> rhi / rhi_adj |
| humidity_scaling_rhi_adj | 0.98 |
| pycontrails_version | 0.58.1.dev2 |
| waypoint | longitude | latitude | true_airspeed | mach_number | aircraft_mass | fuel_flow | engine_efficiency | nvpm_ei_n | altitude | ... | rf_sw_mean | rf_sw_min | rf_sw_max | rf_lw_mean | rf_lw_min | rf_lw_max | rf_net_mean | rf_net_min | rf_net_max | cocip | |
|---|---|---|---|---|---|---|---|---|---|---|---|---|---|---|---|---|---|---|---|---|---|
| 0 | 0 | -10.070 | 55.185 | 230.858 | 0.791 | 236479.000 | 1.654 | 0.4 | 1500000000000000 | 10972.8 | ... | NaN | NaN | NaN | NaN | NaN | NaN | NaN | NaN | NaN | 0.0 |
| 1 | 1 | -10.273 | 55.222 | 230.682 | 0.790 | 236379.755 | 1.657 | 0.4 | 1500000000000000 | 10972.8 | ... | NaN | NaN | NaN | NaN | NaN | NaN | NaN | NaN | NaN | 0.0 |
| 2 | 2 | -10.476 | 55.258 | 230.563 | 0.789 | 236280.355 | 1.659 | 0.4 | 1500000000000000 | 10972.8 | ... | NaN | NaN | NaN | NaN | NaN | NaN | NaN | NaN | NaN | 0.0 |
| 3 | 3 | -10.680 | 55.295 | 230.501 | 0.789 | 236180.791 | 1.661 | 0.4 | 1500000000000000 | 10972.8 | ... | NaN | NaN | NaN | NaN | NaN | NaN | NaN | NaN | NaN | 0.0 |
| 4 | 4 | -10.883 | 55.331 | 230.476 | 0.789 | 236081.128 | 1.662 | 0.4 | 1500000000000000 | 10972.8 | ... | NaN | NaN | NaN | NaN | NaN | NaN | NaN | NaN | NaN | 0.0 |
| ... | ... | ... | ... | ... | ... | ... | ... | ... | ... | ... | ... | ... | ... | ... | ... | ... | ... | ... | ... | ... | ... |
| 157 | 157 | -49.002 | 61.027 | 254.806 | 0.860 | 220251.787 | 1.814 | 0.4 | 1500000000000000 | 10972.8 | ... | NaN | NaN | NaN | NaN | NaN | NaN | NaN | NaN | NaN | 0.0 |
| 158 | 158 | -49.274 | 61.019 | 255.051 | 0.861 | 220142.920 | 1.830 | 0.4 | 1500000000000000 | 10972.8 | ... | NaN | NaN | NaN | NaN | NaN | NaN | NaN | NaN | NaN | 0.0 |
| 159 | 159 | -49.546 | 61.010 | 255.317 | 0.862 | 220033.115 | 1.811 | 0.4 | 1500000000000000 | 10972.8 | ... | NaN | NaN | NaN | NaN | NaN | NaN | NaN | NaN | NaN | 0.0 |
| 160 | 160 | -49.818 | 61.000 | 255.063 | 0.862 | 219924.426 | 0.309 | 0.4 | 1500000000000000 | 10972.8 | ... | NaN | NaN | NaN | NaN | NaN | NaN | NaN | NaN | NaN | 0.0 |
| 161 | 161 | -50.000 | 61.000 | 235.015 | 0.794 | 219912.051 | 1.567 | 0.4 | 1500000000000000 | 10972.8 | ... | NaN | NaN | NaN | NaN | NaN | NaN | NaN | NaN | NaN | 0.0 |
162 rows × 68 columns
[11]:
fl_out.dataframe.columns
[11]:
Index(['waypoint', 'longitude', 'latitude', 'true_airspeed', 'mach_number',
       'aircraft_mass', 'fuel_flow', 'engine_efficiency', 'nvpm_ei_n',
       'altitude', 'time', 'flight_id', 'level', 'air_pressure',
       'air_temperature', 'specific_humidity', 'u_wind', 'v_wind', 'rhi',
       'tau_cirrus', 'specific_cloud_ice_water_content', 'rho_air', 'sdr',
       'segment_length', 'sin_a', 'cos_a', 'G', 'T_sat_liquid', 'rh',
       'rh_critical_sac', 'sac', 'T_critical_sac', 'width', 'depth', 'rhi_1',
       'air_temperature_1', 'specific_humidity_1', 'altitude_1',
       'persistent_1', 'dT_dz', 'ds_dz', 'dz_max', 'rho_air_1', 'iwc_1',
       'f_surv', 'n_ice_per_m_0', 'n_ice_per_m_1', 'ef', 'contrail_age',
       'sdr_mean', 'sdr_min', 'sdr_max', 'rsr_mean', 'rsr_min', 'rsr_max',
       'olr_mean', 'olr_min', 'olr_max', 'rf_sw_mean', 'rf_sw_min',
       'rf_sw_max', 'rf_lw_mean', 'rf_lw_min', 'rf_lw_max', 'rf_net_mean',
       'rf_net_min', 'rf_net_max', 'cocip'],
      dtype='object')
The cocip variable describes where persistent contrails form. It can take on values:
1: Persistent contrails form
0: No persistent contrails form
[12]:
fl_out["cocip"]
[12]:
array([0., 0., 0., 0., 0., 0., 0., 0., 0., 0., 0., 0., 0., 0., 0., 0., 0.,
       0., 0., 0., 0., 0., 0., 0., 0., 0., 0., 0., 0., 1., 1., 1., 1., 1.,
       1., 1., 1., 1., 1., 1., 1., 1., 1., 1., 1., 1., 1., 1., 1., 1., 1.,
       1., 1., 1., 1., 1., 0., 0., 0., 0., 0., 0., 0., 0., 0., 0., 0., 0.,
       0., 0., 0., 0., 0., 0., 0., 0., 0., 0., 0., 0., 0., 0., 0., 0., 0.,
       0., 0., 0., 0., 0., 0., 0., 0., 0., 0., 0., 0., 0., 0., 0., 0., 0.,
       0., 0., 0., 0., 0., 0., 0., 0., 0., 0., 0., 0., 0., 0., 0., 0., 0.,
       0., 0., 0., 0., 0., 0., 0., 0., 0., 0., 0., 0., 0., 0., 0., 0., 0.,
       0., 0., 0., 0., 0., 0., 0., 0., 0., 0., 0., 0., 0., 0., 0., 0., 0.,
       0., 0., 0., 0., 0., 0., 0., 0., 0.])
The cocip instance contains information about the contrail created when cocip.eval is run.
cocip.sourceis the original input flight with additional variables addedcocip.contrailis apandas.DataFramewith the contrail properties at each evolution time step
[13]:
cocip.contrail
[13]:
| waypoint | flight_id | formation_time | time | age | longitude | latitude | altitude | level | continuous | ... | dn_dt_agg | dn_dt_turb | rf_sw | rf_lw | rf_net | persistent | ef | timestep | age_hours | dt_integration | |
|---|---|---|---|---|---|---|---|---|---|---|---|---|---|---|---|---|---|---|---|---|---|
| index | |||||||||||||||||||||
| 0 | 29 | fid | 2019-01-05 01:48:44 | 2019-01-05 02:00:00 | 0 days 00:11:16 | -16.010449 | 56.334371 | 10929.188657 | 228.855572 | True | ... | 1.561299e-20 | 0.000025 | 0.0 | 0.092105 | 0.092105 | True | 2.116819e+09 | 0 | 0.187778 | 0 days 00:11:16 |
| 1 | 30 | fid | 2019-01-05 01:49:44 | 2019-01-05 02:00:00 | 0 days 00:10:16 | -16.243715 | 56.380602 | 10926.888681 | 228.938410 | True | ... | 3.985279e-19 | 0.000027 | 0.0 | 1.042960 | 1.042960 | True | 5.918400e+09 | 0 | 0.171111 | 0 days 00:10:16 |
| 2 | 31 | fid | 2019-01-05 01:50:44 | 2019-01-05 02:00:00 | 0 days 00:09:16 | -16.478081 | 56.425542 | 10924.663360 | 229.018583 | True | ... | 6.609164e-19 | 0.000029 | 0.0 | 1.955281 | 1.955281 | True | 8.176968e+09 | 0 | 0.154444 | 0 days 00:09:16 |
| 3 | 32 | fid | 2019-01-05 01:51:44 | 2019-01-05 02:00:00 | 0 days 00:08:16 | -16.714142 | 56.469048 | 10922.741349 | 229.087846 | True | ... | 8.882048e-19 | 0.000030 | 0.0 | 2.946697 | 2.946697 | True | 9.092056e+09 | 0 | 0.137778 | 0 days 00:08:16 |
| 4 | 33 | fid | 2019-01-05 01:52:44 | 2019-01-05 02:00:00 | 0 days 00:07:16 | -16.951521 | 56.510025 | 10921.135885 | 229.145715 | True | ... | 9.415837e-19 | 0.000031 | 0.0 | 3.009290 | 3.009290 | True | 6.847352e+09 | 0 | 0.121111 | 0 days 00:07:16 |
| ... | ... | ... | ... | ... | ... | ... | ... | ... | ... | ... | ... | ... | ... | ... | ... | ... | ... | ... | ... | ... | ... |
| 219 | 55 | fid | 2019-01-05 02:14:48 | 2019-01-05 10:00:00 | 0 days 00:00:00 | -19.233773 | 70.351781 | 11029.728548 | 225.258541 | False | ... | 1.615790e-18 | 0.000002 | 0.0 | 2.791874 | 2.791874 | True | 0.000000e+00 | 16 | 0.000000 | 0 days 00:30:00 |
| 220 | 55 | fid | 2019-01-05 02:14:48 | 2019-01-05 10:30:00 | 0 days 00:00:00 | -18.325187 | 71.087724 | 11041.506948 | 224.840548 | False | ... | 2.074867e-18 | 0.000002 | 0.0 | 3.154099 | 3.154099 | True | 0.000000e+00 | 17 | 0.000000 | 0 days 00:30:00 |
| 221 | 55 | fid | 2019-01-05 02:14:48 | 2019-01-05 11:00:00 | 0 days 00:00:00 | -17.178115 | 71.804377 | 11006.083048 | 226.100022 | False | ... | 1.582720e-18 | 0.000001 | 0.0 | 2.713347 | 2.713347 | True | 0.000000e+00 | 18 | 0.000000 | 0 days 00:30:00 |
| 222 | 55 | fid | 2019-01-05 02:14:48 | 2019-01-05 11:30:00 | 0 days 00:00:00 | -15.767384 | 72.482915 | 10949.409823 | 228.128310 | False | ... | 7.451845e-19 | 0.000001 | 0.0 | 2.047073 | 2.047073 | True | 0.000000e+00 | 19 | 0.000000 | 0 days 00:30:00 |
| 223 | 55 | fid | 2019-01-05 02:14:48 | 2019-01-05 12:00:00 | 0 days 00:00:00 | -14.095769 | 73.106721 | 10942.469390 | 228.377714 | False | ... | 1.055616e-18 | 0.000001 | 0.0 | 2.378087 | 2.378087 | True | 0.000000e+00 | 20 | 0.000000 | 0 days 00:30:00 |
224 rows × 57 columns
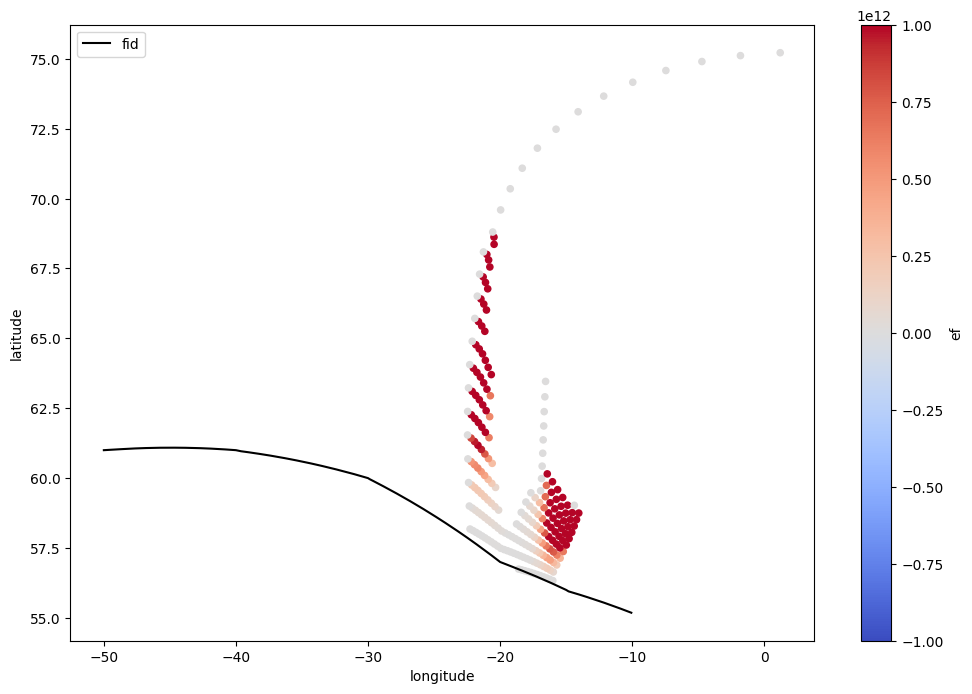
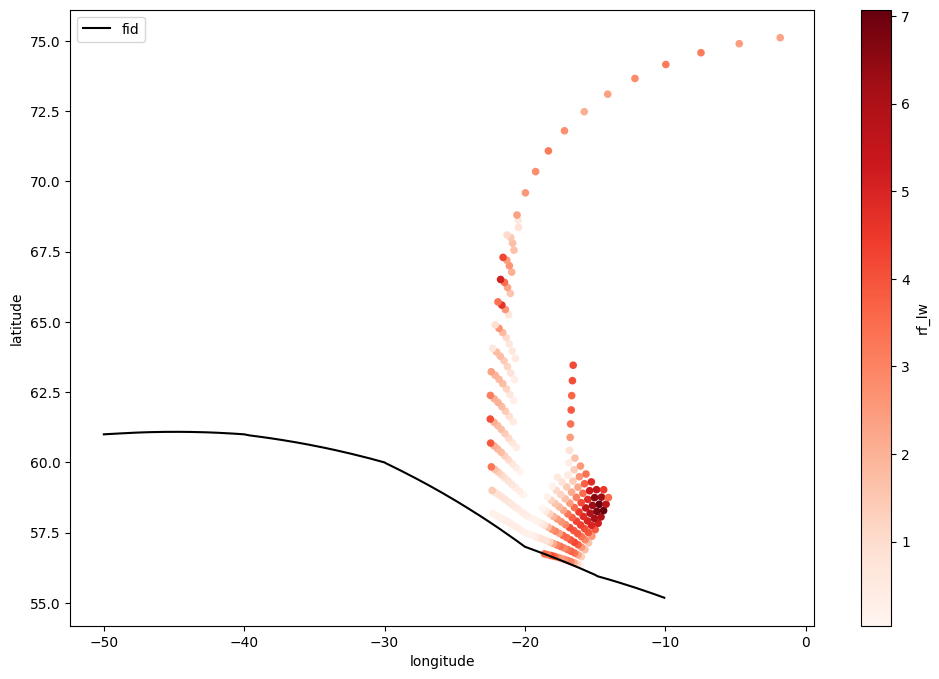
We can visualize the contrail on top of the original flight trajectory using pandas plotting capabilities
[14]:
ax = cocip.source.dataframe.plot(
    "longitude",
    "latitude",
    color="k",
    label="flight",
    figsize=(12, 8),
)
cocip.contrail.plot.scatter(
    "longitude",
    "latitude",
    c="rf_lw",
    cmap="Reds",
    ax=ax,
    label="Contrail RF",
);
[15]:
ax = cocip.source.dataframe.plot(
    "longitude",
    "latitude",
    color="k",
    label="flight",
    figsize=(12, 8),
)
cocip.contrail.plot.scatter(
    "longitude",
    "latitude",
    c="ef",
    cmap="coolwarm",
    vmin=-1e12,
    vmax=1e12,
    ax=ax,
    label="Contrail EF",
);