Aircraft Performance
Aircraft performance affects engine emissions and contrail formation.
pycontrails includes built-in support for two aircraft performance models:
BADA (Requires pycontrails-bada extension and data files obtained through the BADA license.)
Alternate Models
Aircraft performance can be pre-computed and provided directly to models. Other performance models include:
OpenAP: Open-source aircraft performance and emissions model
PianoX: Aircraft design, performance, and emissions tool
Aircraft OEMs and flight planning systems generally have the most accurate performance models.
Poll-Schumann Trajectory Model
The Poll-Schumann model was developed to address the need for simple, yet accurate, methods for the estimation of cruise fuel burn and other important aircraft performance parameters.
References
D.I.A. Poll and U. Schumann. An estimation method for the fuel burn and other performance characteristics of civil transport aircraft in the cruise. Part 1 fundamental quantities and governing relations for a general atmosphere. The Aeronautical Journal, 125(1284):257–295, February 2021. doi:10.1017/aer.2020.62.
D.I.A. Poll and U. Schumann. An estimation method for the fuel burn and other performance characteristics of civil transport aircraft during cruise: part 2, determining the aircraft’s characteristic parameters. The Aeronautical Journal, 125(1284):296–340, February 2021. doi:10.1017/aer.2020.124.
[1]:
import pandas as pd
from matplotlib import pyplot as plt

from pycontrails import Flight
from pycontrails.models.ps_model import PSFlight
[2]:
# Load flight from csv file
attrs = {"flight_id": "1", "aircraft_type": "A320"}
flight = Flight(data=pd.read_csv("data/flight-ap.csv"), attrs=attrs)
[3]:
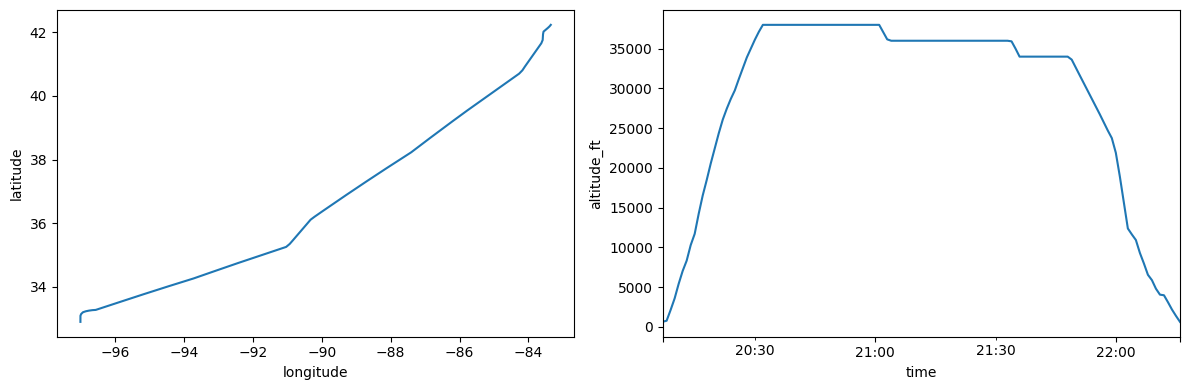
# Plot the horizontal and vertical profiles
fig, (ax1, ax2) = plt.subplots(1, 2, figsize=(12, 4))
flight.plot(ax=ax1)
flight.plot_profile(ax=ax2)

plt.tight_layout()
[4]:
# Create PS Flight model and evaluate
ps_model = PSFlight(
    fill_low_altitude_with_isa_temperature=True,  # Estimate temperature using ISA
    fill_low_altitude_with_zero_wind=True,  # Estimate airspeed by using groundspeed
)
out = ps_model.eval(flight)
[5]:
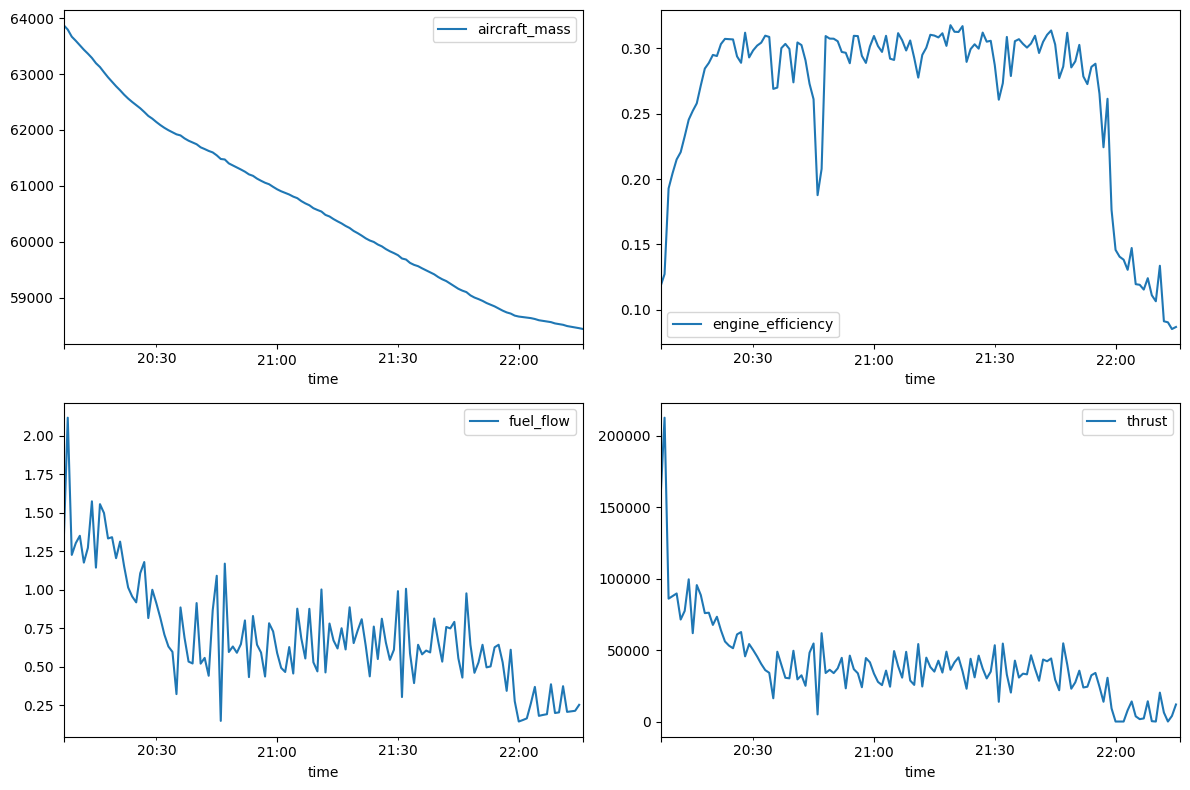
# Visualize outputs
fig, ((ax1, ax2), (ax3, ax4)) = plt.subplots(2, 2, figsize=(12, 8))
out.dataframe.plot(x="time", y="aircraft_mass", ax=ax1)
out.dataframe.plot(x="time", y="engine_efficiency", ax=ax2)
out.dataframe.plot(x="time", y="fuel_flow", ax=ax3)
out.dataframe.plot(x="time", y="thrust", ax=ax4)

plt.tight_layout()
Poll-Schumann Grid Model
The PSGrid model exists to compute nominal Poll-Schumann aircraft performance on a meteorological grid.
Goal
For a given aircraft type, altitude, aircraft mass, air temperature, and mach number, the PS model computes a theoretical engine efficiency and fuel flow rate for an aircraft under cruise conditions. Letting the aircraft mass vary and fixing the other parameters, the engine efficiency curve attains a single maximum at a particular aircraft mass. By solving this implicit equation, the PS model can be used to compute the aircraft mass that maximizes engine efficiency for a given set of parameters. This is the “nominal” aircraft mass computed by this model.
This nominal aircraft mass is not always realizable. For example, the maximum engine efficiency may be attained at an aircraft mass that is less than the operating empty mass of the aircraft. This model determines the minimum and maximum possible aircraft mass for a given set of parameters using a simple heuristic. The nominal aircraft mass is then clipped to this range.
[6]:
from pycontrails.datalib.ecmwf import ERA5
from pycontrails.models.ps_model import PSGrid
[7]:
# Load meteorology data
time = "2022-03-01 07:00:00"
pressure_levels = [250]
variables = ["air_temperature"]

era5 = ERA5(time=time, variables=variables, pressure_levels=pressure_levels)
met = era5.open_metdataset()
[8]:
# Run PSGrid model
model = PSGrid(met, aircraft_type="A320")
out = model.eval()
[9]:
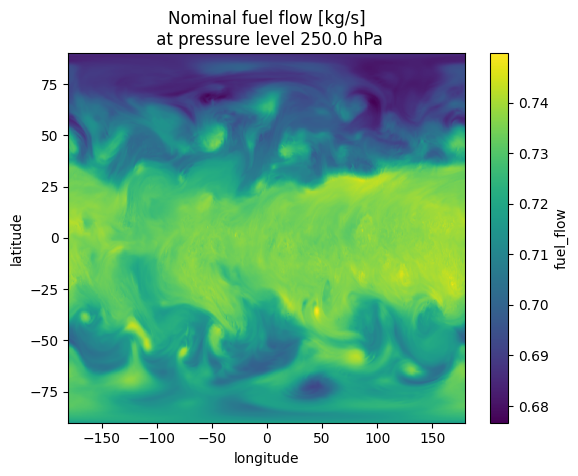
# Visualize outputs
fig, (ax1, ax2) = plt.subplots(1, 2, figsize=(12, 4))

out["aircraft_mass"].data.plot(x="longitude", y="latitude", ax=ax1)
ax1.set_title(f"Nominal aircraft mass [kg]\n at pressure level {out.data['level'].values[0]} hPa")

out["fuel_flow"].data.plot(x="longitude", y="latitude", ax=ax2)
ax2.set_title(f"Nominal fuel flow [kg/s]\n at pressure level {out.data['level'].values[0]} hPa")

plt.tight_layout()